I recently read a book about the education system in Sweden (”Glädjeparadoxen” [The paradox of Happiness]). The book is indeed interesting, dealing with the question why Swedish pupils has fallen behind in the big international tests such as PISA. However, it was another thing I found interesting. It is well known that the Swedish society is more individualistic than most other countries (however, I have some objection to what is usually meant by individualism in general — I maybe write about that in another post). But in the book the authors claim values in Sweden was more collective than in most other countries in the beginning of the 1980’s, and that it is only lately that Sweden has become more individualistic (with reference to Santos et.al (2017)). In this post I will make a brief test whit data from World Value Survey (WVS). The measure I will use is difference in how important friends are relative the family. According to Santos et.al (2017) this is a well known indicator for individualism (I am somewhat sceptical though — but maybe more about this in another post). Of course to be able to really answer the question we would most likely need more variables. But this is just a small test.
Data
The data used in the study was World Value Survey (WVS), which can be found here. Sweden is not part of all the waves, and the questions we need is only included in later data sets. I will therefore use four waves (wave 3, 4 5, and 6). In years we will be measuring changes in individualism from 1990 to 2014. This is not bad at all even though we do not go back the early 1980’s. On the other hand — how likely is it that all changes from the early 1980’s until today happened during the 1980’s?
The code
After reading the code into R I did the following with the waves (here only one of the wave (wave 6) is shown).
Frist I made all letters to lower case:
names (wd6) <- tolower (names(wd6))
Then I transformed the country codes into the names of the countries using the countrycoce package.
library(countrycode)
wd6$cntry <- countrycode (wd6$v2, origin = "wvs", destination = "un.name.en")
Next step is to construct the variable measuring individualism — which is the importance of friends minus the importance of the family. The higher the numbers the more individualized.
wd6$family <- ifelse (wd6$v4 < 0, NA, wd6$v4)
wd6$friends <- ifelse (wd6$v5 < 0, NA, wd6$v5)

wd6$family <- (wd6$family - (max(wd6$family, na.rm = TRUE))) *-1
wd6$friends <- (wd6$friends - (max(wd6$friends, na.rm = TRUE))) *-1

wd6$individualism <- wd6$friends - wd6$family
Now I have the two variables I need. But to make the results easier on the eyes I only selected some of the countries — using the subset-command:
wd6$cntry_select <- recode (wd6$cntry, '
"Australia" = 1;
"Estonia" = 1;
"Germany" = 1;
"Netherlands" = 1;
"New Zealand" = 1;
"Poland" = 1;
"Romania" = 1;
"Spain" = 1;
"Sweden" = 1;
"United States of America" = 1;
else = 0')

wd6 <- subset (wd6, cntry_select==1)
Now I have to construct a new data fram with the data to use to make graphs. To do this I first calculated the mean value of the variable individualism in each country by using tapply
t6 <- tapply (wd6$individualism, list(wd6$cntry), FUN = mean, na.rm=TRUE)
round (cbind (t6), 3)
From the result I created two variables: country and individualism — and put them in a new data frame.
country <- c (
"Australia",
"Estonia",
"Germany",
"Netherlands",
"New Zealand",
"Poland",
"Romania",
"Spain",
"Sweden",
"United States of America")

individualism <- c(
-0.397,
-0.463,
-0.308,
-0.375,
-0.403,
-0.602,
-0.996,
-0.423,
-0.197,
-0.403)

df6 <- data.frame (country, individualism)
The last step is to produce the graph. This is done with the ggplot2-package.
library (ggplot2)

p6 <- ggplot (data=df, aes(x= reorder (country, -individualism), y=individualism)) +
    geom_bar (stat="identity", position=position_dodge()) +
    labs (x="Country", y="Individualism") +
    theme(axis.text.x=element_text(angle=90,hjust=1,vjust=0.5))
The results from the waves can be seen below.
Results/Figures
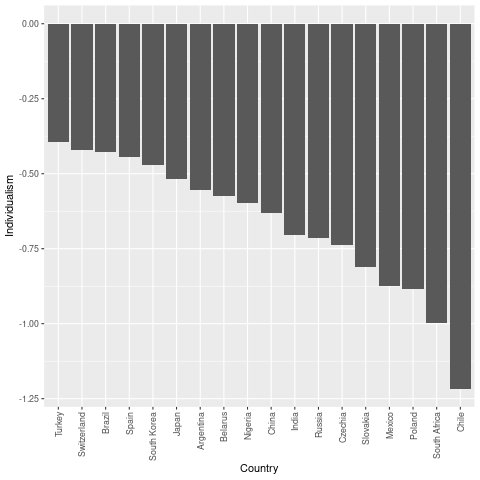
Figure 1: Wave 2: 1990-94
As can be see Sweden was not part of the second wave (1990-1994). Somewhat suprinsing the level of individualism was greatest in Turkey — greater than in countries such as Spain and Brazil. But to be fair — none of the countries presented in figure 1 are known to have high levels of individualism (as far as I know at least).

Figure 2: Wave 3: 1995-1998
Figure 3: Wave 4: 1999-2002
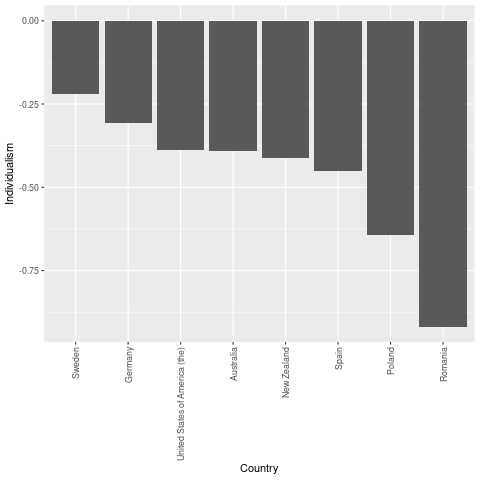 Figure 4: wave 5: 2005-2006
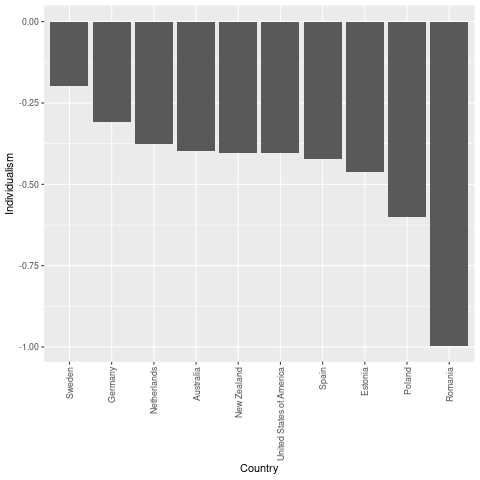
Figure 5: wave 6: 2010-2014
From Figure 2 to 5 Sweden is included in the Figures. As can be seen Sweden has the highest level of individualism among the included countries in all of the waves. For Sweden the results seems to be stable, while for example USA seems to be falling behind. Let’s look closer into this. In the graph below the development of individualism is investigated in Sweden, USA, Germany and Spain.
To do this I created a data set with the values for the four countries, looking like this:
| Country | Individualism | Wave | |
|---|---|---|---|
| 1 | Sweden | -0.207 | Wave 1 |
| 2 | Sweden | -0.187 | Wave 2 |
| 3 | Sweden | -0.219 | Wave 3 |
| 4 | Sweden | -0.197 | Wave 4 |
| 5 | USA | -0.291 | Wave 1 |
| 6 | USA | -0.343 | Wave 2 |
| 7 | USA | -0.387 | Wave 3 |
| 8 | USA | -0.403 | Wave 4 |
| 9 | Spain | -0.508 | Wave 1 |
| 10 | Spain | -0.467 | Wave 2 |
| 11 | Spain | -0.450 | Wave 3 |
| 12 | Spain | -0.423 | Wave 4 |
| 13 | Germany | -0.381 | Wave 1 |
| 14 | Germany | NA | Wave 2 |
| 15 | Germany | -0.307 | Wave 3 |
| 16 | Germany | -0.308 | Wave 4 |
Once again using ggplot2:
p7 <- ggplot (data=df7, aes(x=Wave, y=Individualism, group=Country)) +
geom_line (aes(color=Country), size=1.2) +
geom_point(aes(color=Country), size = 3.1) +
scale_color_brewer(palette="Dark2")
And the result…

Figure 6: Development of individualism in Sweden, USA, Germnay and Spain
As can be seen in Figure 6 the level of individualism is rather stable in both Sweden and Spain, however on very different levels. Individualism is super stable in Germany. In the USA on the other hand individualism seems to be decreasing substantially. From the results here the claim that individualism is a rather late thing in Sweden does not get support. However, more research needs to be done of course!
Literature
Heller-Sahlgren, G., & Sanandaji, N. (2019). Glädjeparadoxen: Historien om skolans uppgång, fall och möjliga upprättelse. Stockholm: Dialogos förlag.
Santos, H. C., Varnum, M. E. W., & Grossmann, I. (2017). Global Increases in Individualism. Psychological Science, 28(9), 1228–1239. https://doi.org/10.1177/0956797617700622
Lämna ett svar